Milan's graffiti do not predict crime: the broken windows theory tested against data
An analysis of 4,006 streets cross-references visual blight with crimes reported in the news. The result overturns a widespread assumption.
Are Milan's most vandalised streets also its most dangerous? The broken windows theory -- the idea that visible disorder breeds crime -- has been an urban-planning staple for four decades. An investigation covering all 4,006 streets in the city, cross-referencing automated graffiti and waste detection with a safety index built on crime reporting, delivers a clear-cut answer: for graffiti, the link does not exist.
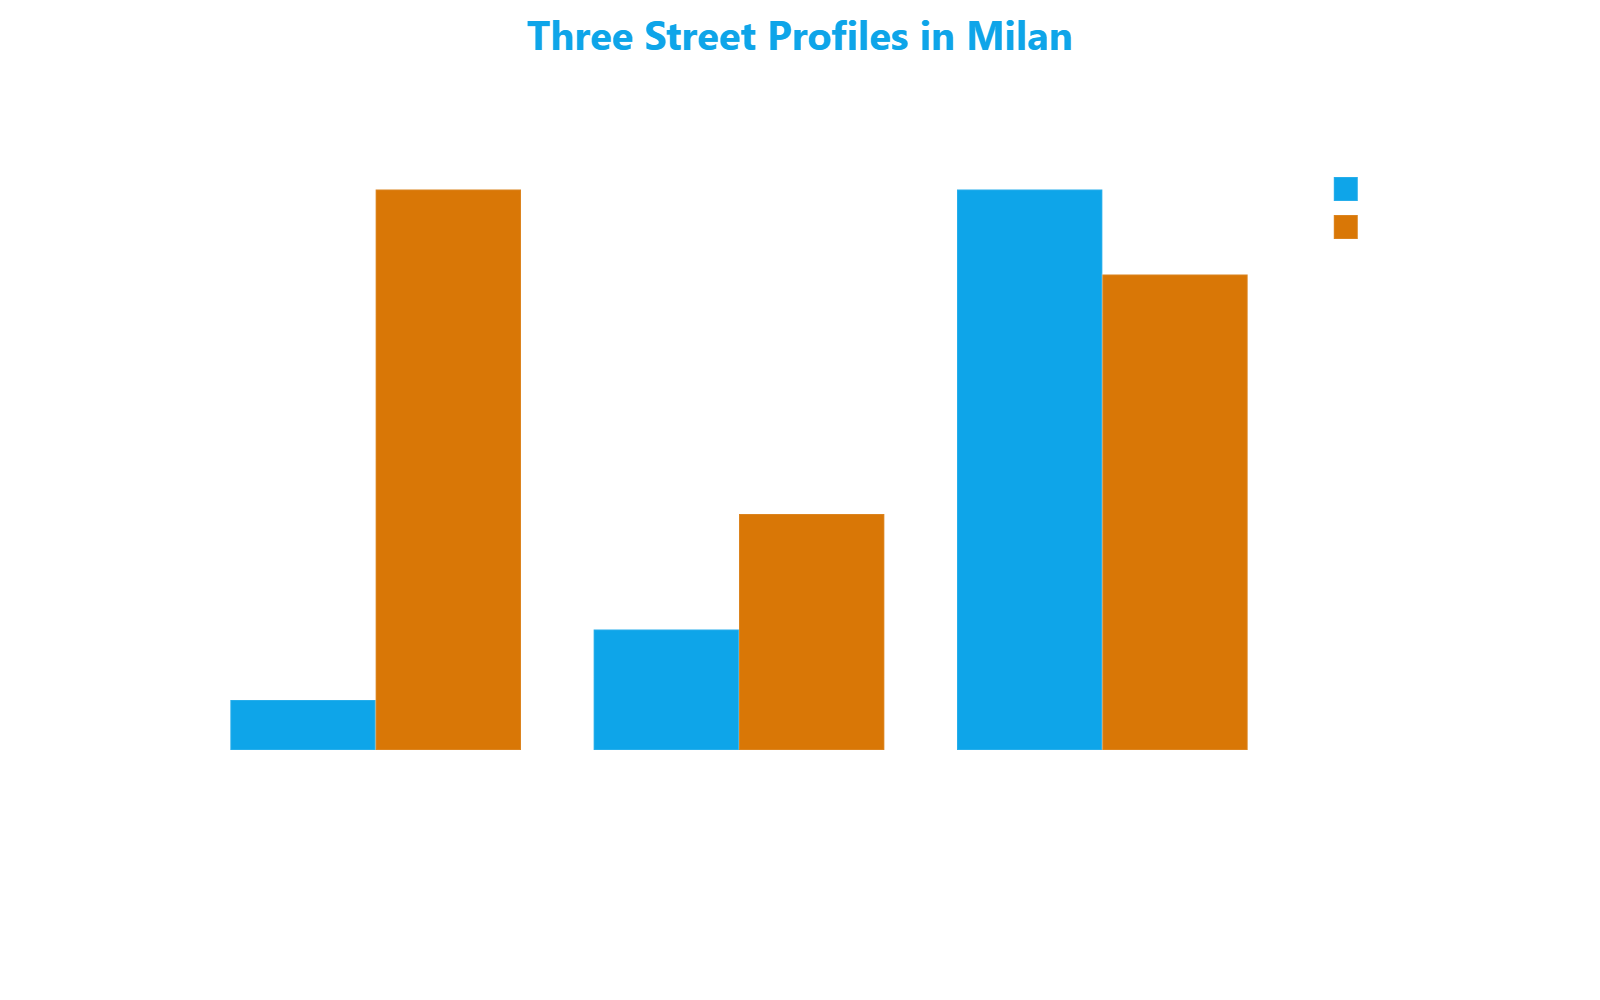
468 vandalised streets, safety within the norm
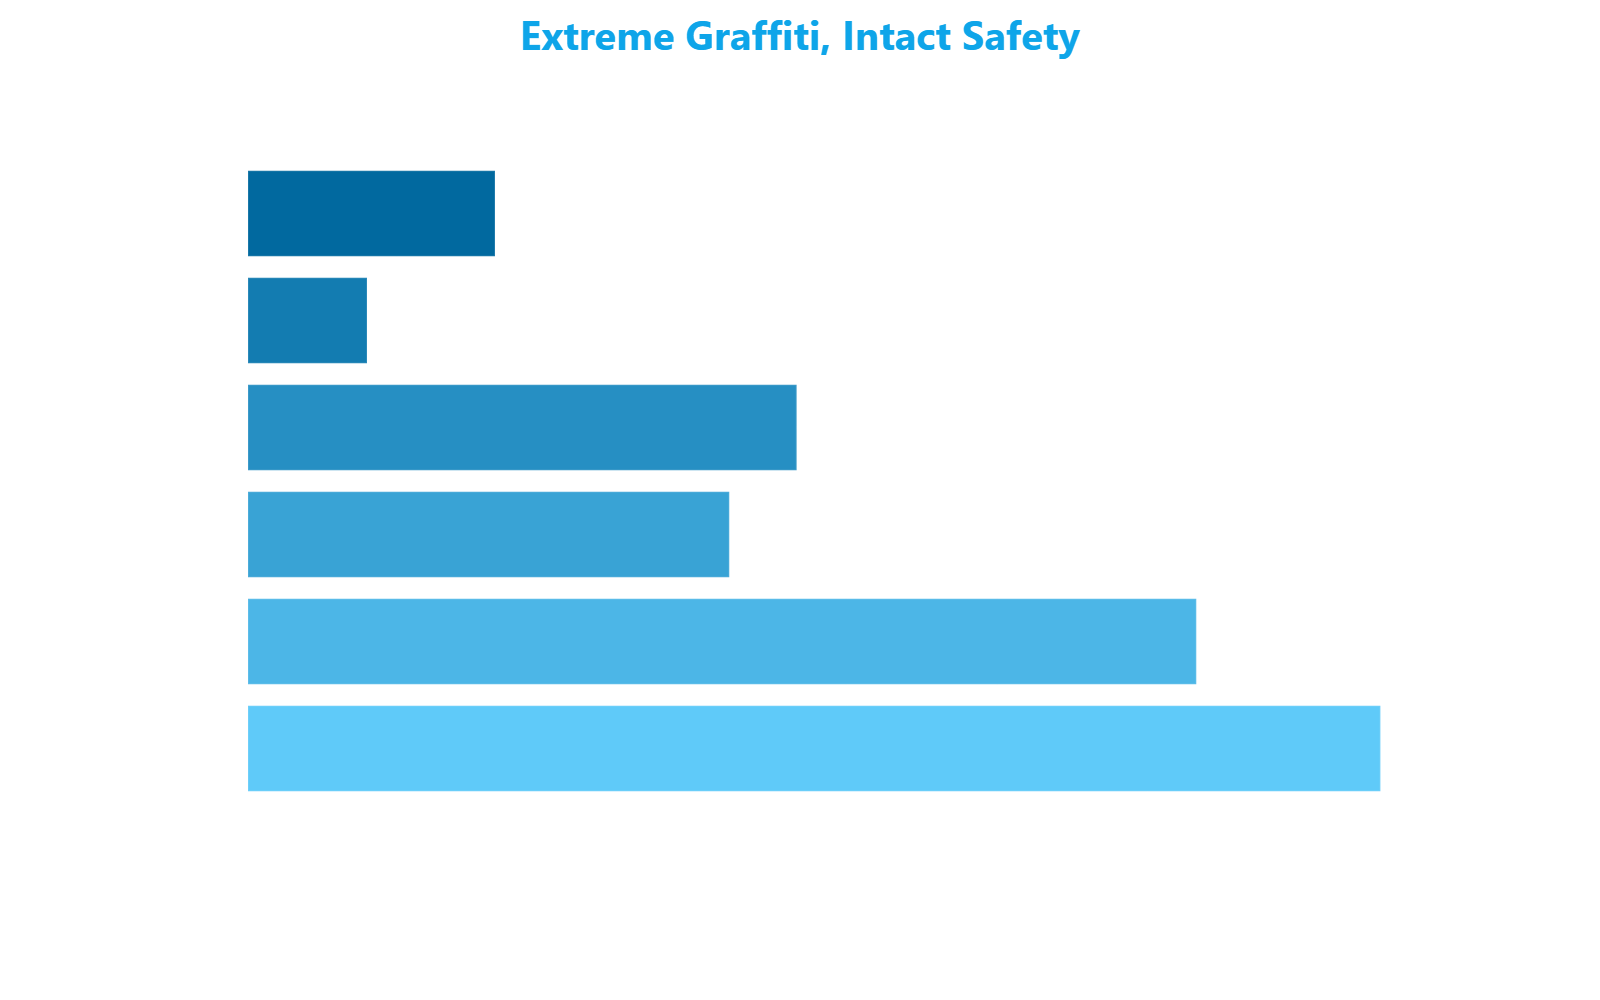
The most telling finding comes from a group of 468 streets -- 11.7% of the total -- that concentrate extreme graffiti levels: 77.2 detections per 100 linear metres, more than ten times the citywide median of 7.25. Streets where tagging covers every available surface.
Their safety index? 65.5 out of 100 -- just below the citywide median of 68.9, essentially within the norm. When each street is compared with its surrounding roads, safety actually turns out slightly higher than the neighbourhood average.
Via Piero Strozzi has a graffiti residual of +154 above its neighbours while simultaneously scoring nearly 13 points above the local safety norm. Via Guglielmo Pecori Giraldi follows the same pattern: extreme graffiti and safety 15 points above surrounding streets. Viale Emilio Caldara in the Navigli area, via Morivione in Vigentino, via Padre Carlo Salerio: the pattern repeats. These streets cluster in southern, south-western and Navigli neighbourhoods -- residential or semi-central areas where street writing is widespread as an urban phenomenon without translating into a concentration of reported crimes.
What is the correlation between graffiti and crime in Milan?
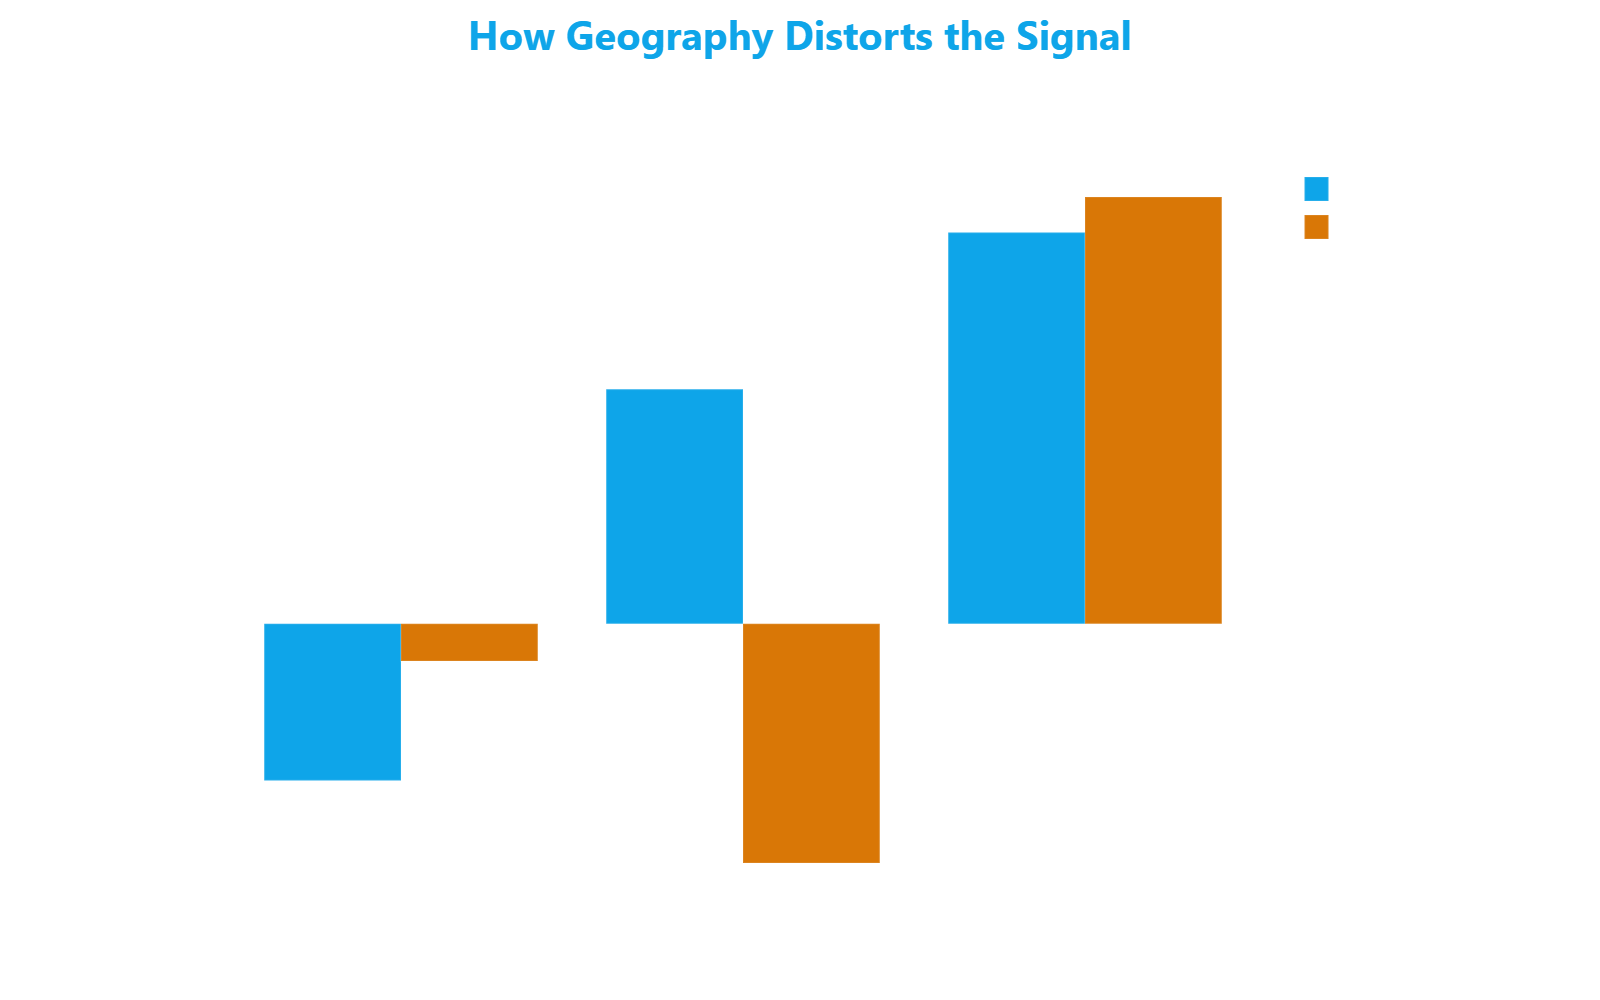
Based on the analysis of 4,006 Milan streets, the correlation between graffiti density and crimes reported in news media is -0.02 after controlling for geographic position: statistically indistinguishable from zero. Seventy-six percent of the apparent correlation in raw data was a geographic artefact, not a real relationship.
The absence of correlation is not a footnote
When nearby streets are compared directly -- thereby isolating the effect of geographic position -- the correlation between graffiti density and reported crimes drops to -0.02: statistically indistinguishable from zero. 76% of the apparent correlation in the raw data was an effect of geography, not of a real relationship.
This is not an edge case. Of the 4,006 streets analysed, 431 (10.8%) show graffiti and waste above the local norm alongside safety also above the local norm. They outnumber the 377 streets (9.4%) that combine visual blight with higher crime reporting. The majority of visually degraded streets are not associated with a higher incidence of reported crimes.
Abandoned Waste tells a different story
While graffiti shows no link to safety, Abandoned Waste paints a different picture -- one that features a noteworthy sign reversal.
At the raw level, streets with more waste are paradoxically safer. The reason is a geographic artefact: dense central areas produce more waste due to higher foot traffic but also benefit from greater surveillance and lighting, with fewer reported crimes. After controlling for position, the sign flips: streets with more waste than their neighbours tend to have slightly lower safety than surrounding roads.
The effect is genuine but modest: it explains roughly 2% of the variance. Blight does not generate crime, nor does crime generate blight -- the system measures co-occurrence, not causation. But the finding clearly separates waste from graffiti: of the two visual-blight indicators, only waste shows an association, however weak, with reported crimes.
Is Abandoned Waste linked to crime in Milan?
Unlike graffiti, Abandoned Waste shows a weak but statistically significant association with crimes reported in news media, once geographic position is controlled for. The effect explains about 2% of the variance and represents co-occurrence rather than causation, but it clearly distinguishes waste from the graffiti phenomenon.
Two forms of blight, one fabric of neglect
Graffiti and waste, for their part, genuinely co-occur. Where a street has more graffiti than its neighbours, it also tends to have more waste -- a moderate correlation that survives spatial controls and does not depend on safety. They are different manifestations of the same phenomenon of urban neglect, but with distinct implications for crime reporting.
Crime-report hotspots are elsewhere -- and transient
The 795 streets with the worst crime-report safety scores -- an index of 32.5 out of 100, less than half the citywide median of 68.9 and well below the 25th percentile (52.0) -- are not the most vandalised. Their graffiti density stands at 16.6 per 100 metres, above the median but far from extreme levels. What sets them apart is something else: reported crimes are sharply higher than on surrounding streets, with a safety residual of -8.6, the largest absolute residual in the entire analysis.
This profile is transient: roughly one third of these streets shift between this state and others over time. Crime reports move, hotspots change. The safety analysis, based on systematic monitoring of news reporting over 75 months, tracks 27 crime categories street by street -- all available in detail on the platform, with type, frequency and trend.
What are Milan's most unsafe streets?
The 795 streets with the worst crime-report safety index score an average of 32.5 out of 100 and are characterised not by visual blight but by a concentration of reported crimes sharply above surrounding streets. The profile is transient: roughly one third of these streets change state over time, with hotspots shifting periodically.
The distinction that matters
The separation between the two blight signals is operationally meaningful. Abandoned Waste, even if weakly, correlates with lower crime-report safety after controlling for position -- a factor that can carry weight in street-level due diligence. Graffiti, however visually striking, show no link to reported crimes: 468 streets demonstrate this with graffiti ten times the norm and safety intact.
The data suggest that visual blight is not a monolithic indicator. What appears on the walls and what lies on the ground tell different stories -- a distinction worth verifying case by case, by cross-referencing visual data with the incidence of reported crimes.
Methodology: the investigation analysed 4,006 Milan streets by cross-referencing three indicators -- Graffiti and Vandalism density and Abandoned Waste (from automated street-level image analysis) with a safety index based on systematic monitoring of news reporting over 75 months and 27 crime categories. Correlations were calculated both in absolute terms and net of the effect of geographic position, comparing each street with its 10-30 nearest neighbours. Significance was verified at a strict threshold (p<0.01). The three-profile segmentation shows high cross-neighbourhood stability (ARI=0.87). The profiles also significantly discriminate indicators not used in the analysis, including Commercial Diversity, restaurants and Retail Offering.
Frequently Asked Questions
Does the broken windows theory hold in Milan?
As far as graffiti is concerned, the analysis of 4,006 Milan streets does not support the broken windows theory. The correlation between graffiti density and crimes reported in news media is statistically zero (-0.02) after controlling for geographic position. For Abandoned Waste a weak but real association exists, though it explains only 2% of the variance.
How many Milan streets have extreme graffiti?
There are 468 streets, representing 11.7% of the total. These roads record an average density of 77.2 graffiti detections per 100 linear metres, more than ten times the citywide median of 7.25. Despite the extreme level of visual vandalism, their safety index (65.5 out of 100) remains essentially within the citywide norm.
Where in Milan is graffiti concentrated?
Streets with the highest graffiti density cluster in the southern, south-western and Navigli areas. These are predominantly residential or semi-central neighbourhoods where street writing is widespread as an autonomous urban phenomenon, without translating into an above-average concentration of reported crimes.
Is Abandoned Waste an indicator of crime?
After controlling for geographic position, streets with more waste relative to surrounding roads tend to have slightly lower safety. The association is statistically significant but modest and represents co-occurrence rather than causation. Waste nonetheless remains a more informative signal than graffiti when assessing street-level safety.
How is street safety measured in Milan?
The safety index is based on systematic monitoring of news reporting over a span of 75 months, covering 27 crime categories tracked street by street. Correlations are calculated both in absolute terms and by comparing each street with its 10-30 nearest neighbours, to isolate the effect of geographic position from the actual relationship between variables.