Navigli - Darsena: A Neighborhood Report
A neighborhood-level deep dive -- July 2026. A profile of contrasts: a strong social and retail fabric and sharply rising prices, but marked weaknesses in urban decorum and safety.
Overview
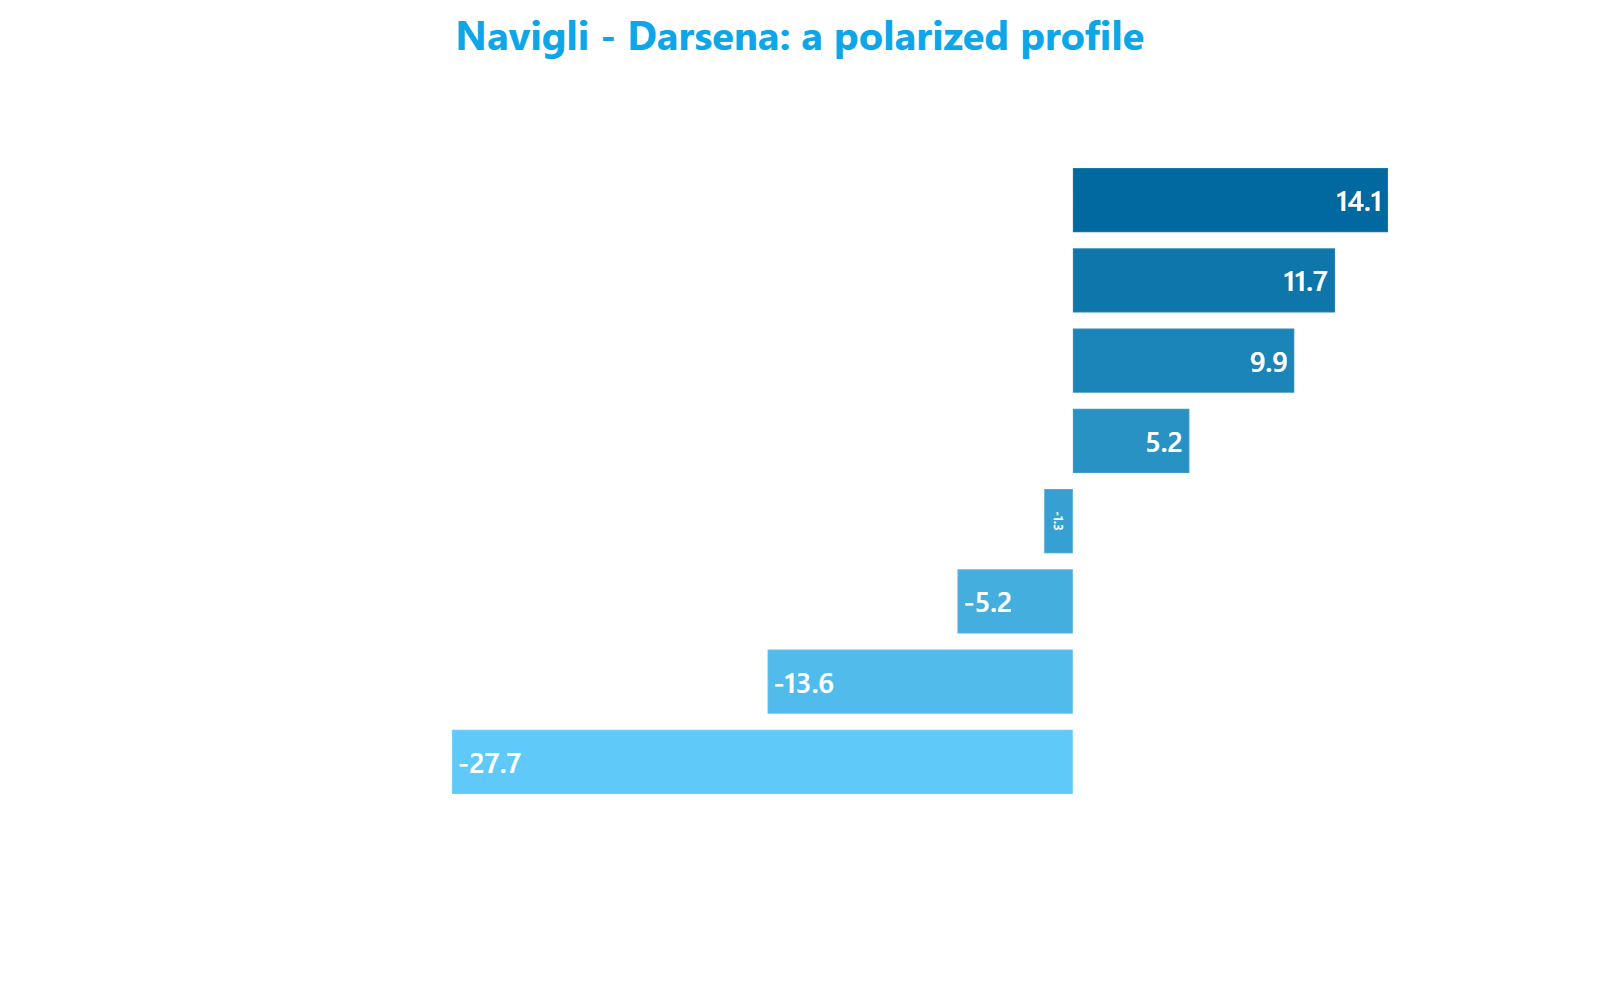
Navigli - Darsena sits in the city's mid-range on the overall CityAdvisor Index (45.79 points, in line with the median of 144 neighborhoods), yet the aggregate figure hides a sharply polarized profile. The neighborhood excels where street life counts -- Social Infrastructure (57.42 points, top 10%), Retail Offering (38.62, top 19%), cycling access and Hospitality Potential -- and struggles where the management of public space weighs heaviest: Urban Decorum in critical territory (48.27, among Milan's ten worst neighborhoods), Road Maintenance and Safety both weak. The thread that holds the profile together is a divergence: over the past five years the price per square meter has risen decisively (+35%) while the safety index has steadily slipped. A neighborhood that is gaining value and transforming -- confirmed by one of the area's most active pipelines of tertiary and infrastructure projects -- yet still carrying unresolved tensions around everyday livability.
Neighborhood Profile
Value and yields. Real Estate Value (50.27 points, essentially the rescaled price per square meter) sits above the neighborhood median (42.34). The average purchase baseline is 5,666 euro per square meter -- roughly a third above the city median of 4,253 euro. This is a zone-level baseline, built by cross-referencing institutional valuations and listings databases: the price of any single property then swings by up to +/-30% depending on floor, elevator, state of repair and energy class. Profitability (41.54, a synthesis of short- and long-term rental yields), by contrast, stays just below the median: long-term rents -- 904 euro for a studio, 1,261 for a one-bedroom, 1,804 for a two-bedroom -- translate into a gross yield of 4.10% and a net yield of 2.61%, squeezed by high purchase prices. Short-term rentals are a different story: with an average rate of 177 euro per night, Hospitality Potential (21.09) is triple the city median (7.03), placing the neighborhood in the top 18% -- the index measures where it pays to open a property, not how many already exist.
Retail Offering and attractiveness. This is where the neighborhood shows its signature. Retail Offering (38.62, an average of density, variety, quality and positioning of businesses) beats the city median by more than a third, with a Shop Density of 38.60 and Commercial Diversity of 34.26. The concentration of restaurants and nightlife is among the highest in Milan -- restaurants and nightspots place Navigli at the very top of the city ranking. Retail Positioning stands at 43.80, below the neutral threshold of 50: a mix of neighborhood retail with a few low-cost signals, not a luxury-brand district. Overall Attractiveness (41.90, the area's appeal across aesthetics, decorum, dining and culture) and Aesthetics (34.37, from automated image analysis) stay in the city's mid-range, held back precisely by the space-care components.
Decorum, maintenance and livability. The weakest front. Urban Decorum (48.27) -- an index that starts at 100 and subtracts penalties for graffiti, litter, run-down buildings and potholes -- is in critical territory, 132nd of 144 neighborhoods, well below the median of 61.89. Road Maintenance (47.43) points the same way, weak and below the median of 52.58. Urban Livability (51.86, a synthesis of services, greenery, soft mobility and quiet) closes just under the median. Family Friendly (67.01, which weighs schools, social infrastructure, safety and greenery) is in line with the city average. Bucking the trend is Social Infrastructure (57.42, gathering spaces), which comes close to excellence at 15th in the city.
Safety. The other structural weakness. The safety index, based on crime-news monitoring, stops at 43.53 -- far below the neighborhood median (71.23) and weak (119th). The safety analysis rests on crime-news monitoring category by category and street by street, with the type, frequency and trend of individual events available in detail on the platform.
Demographics and mobility. The demographic profile (56.67, a synthesis of income, share of Italian residents, graduates and generational mix) is above the median: average declared income of 46,160 euro, a share of Italian residents of 85.94% (24th highest in the city) and an average age of 44.84, among the highest. On Transport (60.15, driven by local public transit) the neighborhood is in line with the city median, but with low Traffic Flow (46.25). Cycling access, by contrast, is a strength: 3,655 meters of bike lanes per square kilometer within 700 meters, above the median of 2,959 and in the top 24%.
Historical Trend
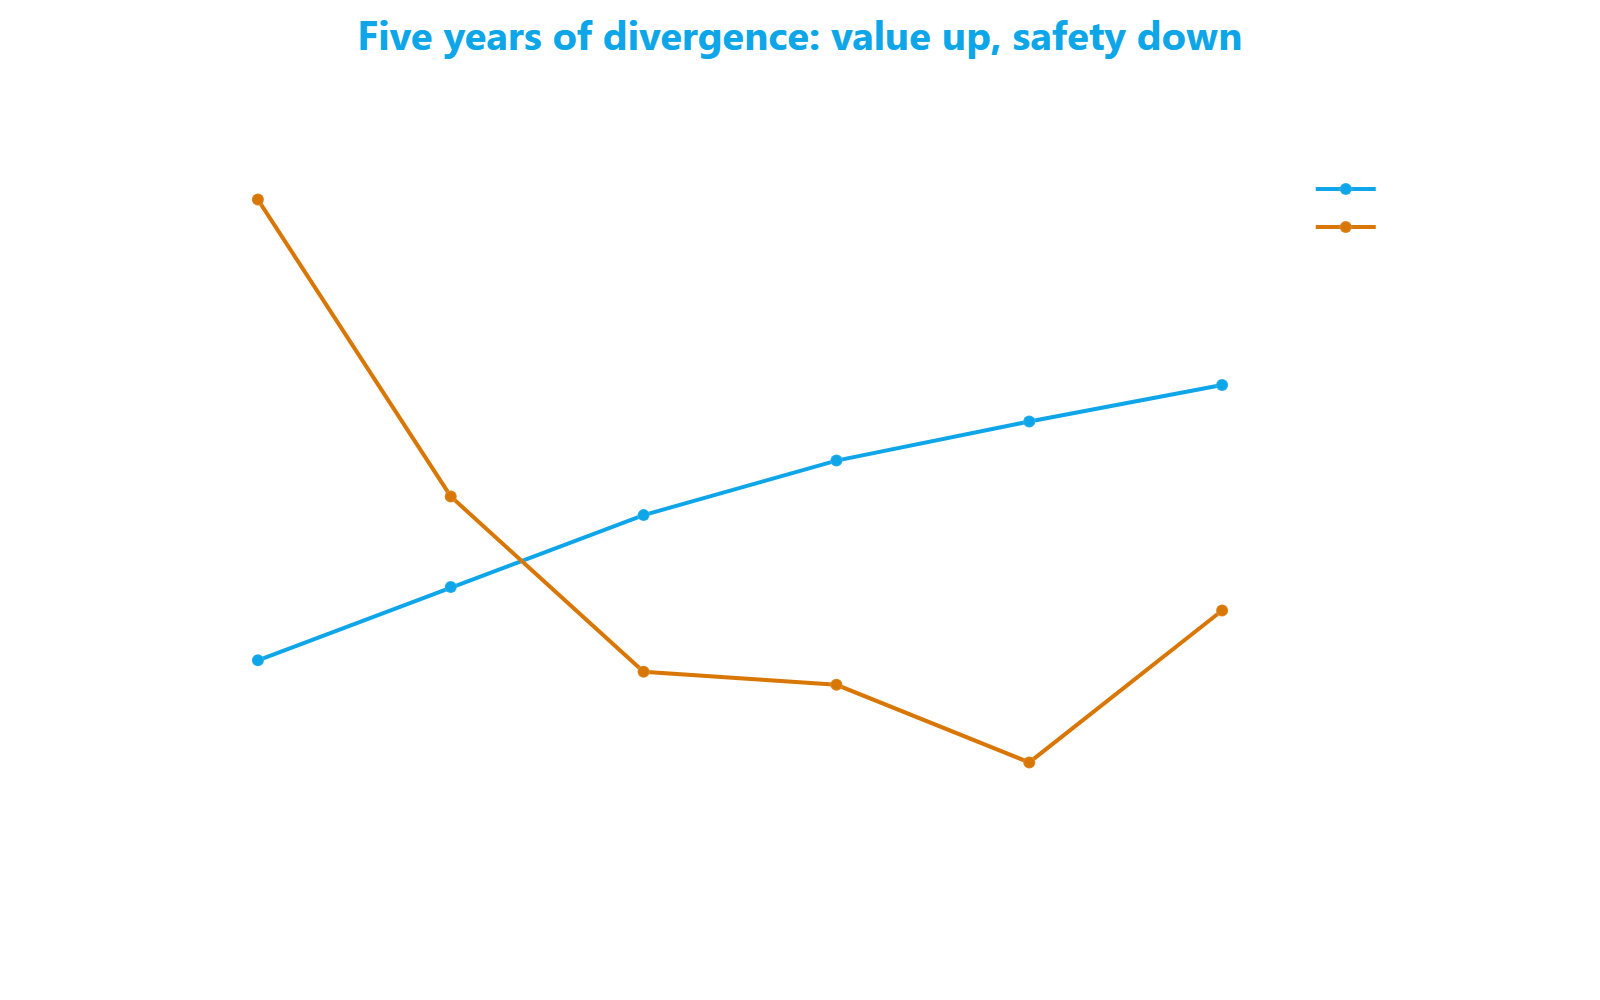
The story of the past five years is a clear divergence between value and livability. The price per square meter has climbed from 4,207 euro in 2021 to today's 5,666 -- a gradual, steady 35% rise that has pulled Real Estate Value from 42.04 to 50.27 points. On the opposite side, Safety has slipped from 55.81 to 43.53 points over the same span, with a decline already visible at the halfway mark and a low reached about a year ago (38.99). Urban Decorum and Road Maintenance also remain below their levels of five years earlier. In short, the neighborhood has become more expensive and more contested just as the perception of order and safety weakened.
The second major movement is the urban one. Urban Development (regeneration projects, a synthesis of transformation and construction-site density) has grown strongly from 15.03 to 26.98 points, Urban Transformation from 13.40 to 25.74, and completed projects within the neighborhood's radius have quadrupled, from 4.64 to 19.55. The socioeconomic fabric has tracked the trajectory of values: average declared income has risen from about 40,200 to 46,160 euro (+15%). Demographic and livability metrics, by contrast, have stayed essentially flat.
Urban Transformation and Projects
The Navigli area is crossed by a pipeline of 61 projects, one of the most active clusters in the zone. Its center of gravity is the transformation of the district between Tortona, Savona and Bergognone into a business and tertiary hub. Its historic flagship is the Armani Headquarter on via Bergognone, a redevelopment designed by Tadao Ando and Michele de Lucchi for Giorgio Armani, completed in the early 2000s; to it have been added the new office headquarters delivered in recent years -- The Sign (building B, NTT Data's offices, 2021) and the building dedicated to L'Oréal Italia (2024). The most significant site currently underway is Tortona 25, four large office buildings under redevelopment at an advanced stage (around 90-93%): completion is expected by 2026.
Alongside the tertiary dimension come urban-scale projects. The area recently saw the completion of the new Circle Line secondary railway station at Romolo (2025), while on the education front the Nuovo Campus MIP Navigli -- a 10-million-euro renovation promoted by the Politecnico di Milano to a design by Il Prisma -- has been operational since 2022. The high-end hospitality segment is anchored by the redevelopment of a 120-room luxury hotel near via Ascanio Sforza (2023). Around these major projects orbit more than fifty smaller ones -- some twenty redevelopments, seventeen new builds and various renovation, extension and restoration works -- which together gradually reshape the neighborhood's fabric. The platform holds a file on every project: class, size, stakeholders, progress and timeline.
Comparison with the Surrounding Area
Against the five physically closest neighborhoods -- Ascanio Sforza (766 m), Solari, Corso Genova, Famagosta and Corso San Gottardo -- Navigli stands out for intensity of urban life and transformation. Its Social Infrastructure (57.42) is the highest in the group, as are its Urban Dynamism (31.43 against a neighbors' average of 20.26, with Ascanio Sforza and Corso San Gottardo nearly static) and its Retail Offering. Its Transport access (60.15) also clearly outstrips neighbors such as Ascanio Sforza (35.95) and Corso San Gottardo (40.23).
The flip side shows up on safety: 43.53 against a neighbors' average of 57.10, with Famagosta (77.07) and Corso San Gottardo at the opposite end. On decorum too, Navigli is the weakest of the group (48.27 against 52.72). On value, the neighborhood is aligned with the neighbors' average (price 5,666 against 5,710 euro), a distance from the premium pole of Corso Genova (7,127 euro, with higher decorum and attractiveness) and above the cheaper, safer Famagosta.
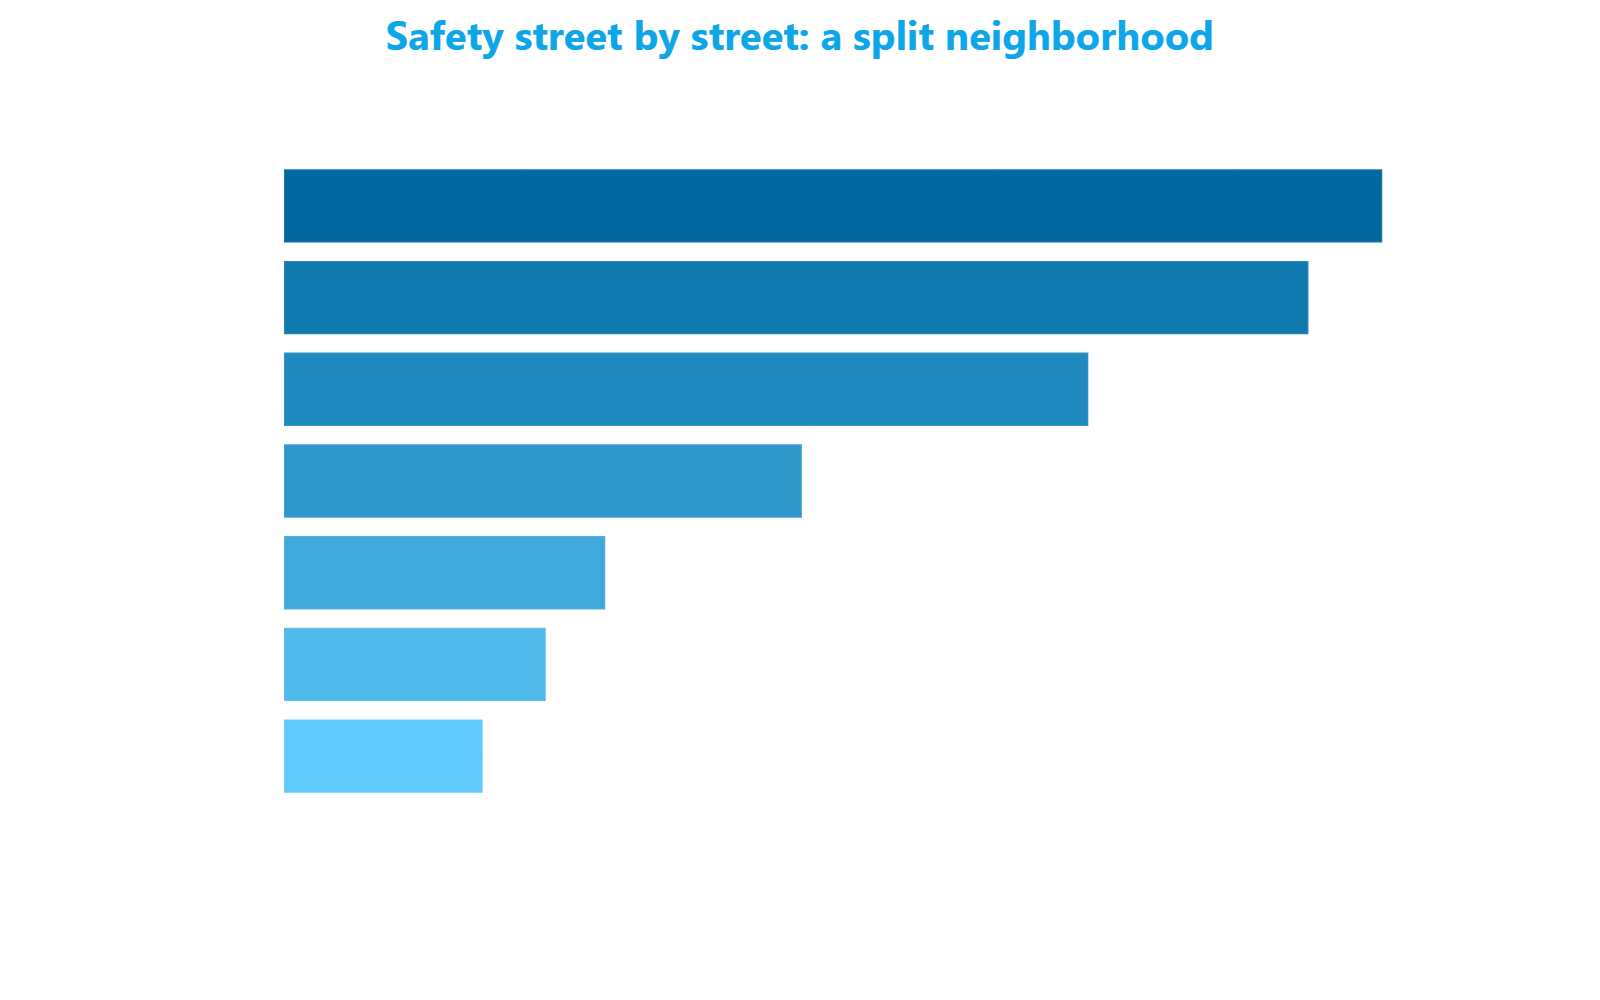
The picture is completed by looking inside the neighborhood, where the heterogeneity across its 47 streets is wide. On safety it ranges from 3.90 to 92.30 points, on decorum from 0 to 83.87: the average index compresses opposite realities. The best-positioned streets on the overall index -- Via Vincenzo Forcella, Viale Romolo (safety 92.30), Via Carlo Torre -- are orderly residential axes; at the bottom sit Via Giovanni Segantini, Via Giosuè Borsi and Via Emilio Gola, where safety drops below 25 points. The price per square meter, by contrast, is more uniform, between 4,392 and 6,848 euro. A neighborhood, ultimately, that should be read street by street rather than by average -- a contrast between vitality and livability to be explored case by case.
Methodology: a monographic report based on 20 metrics computed across 144 Milan neighborhoods. Period: July 2026. Rankings indicate the position in the city distribution (1 = highest value). Neighborhood values are the average of the streets that compose it (47 for Navigli - Darsena). Neighbors identified by haversine distance between centroids. Data from public and proprietary sources, covering 4,006 streets, 105 metrics and monthly history since January 2020.