Milan's 10 Most Livable Neighborhoods in March 2026: The Ranking
Services, green space, mobility, and quiet: where daily quality of life peaks, based on an analysis of 144 neighborhoods.
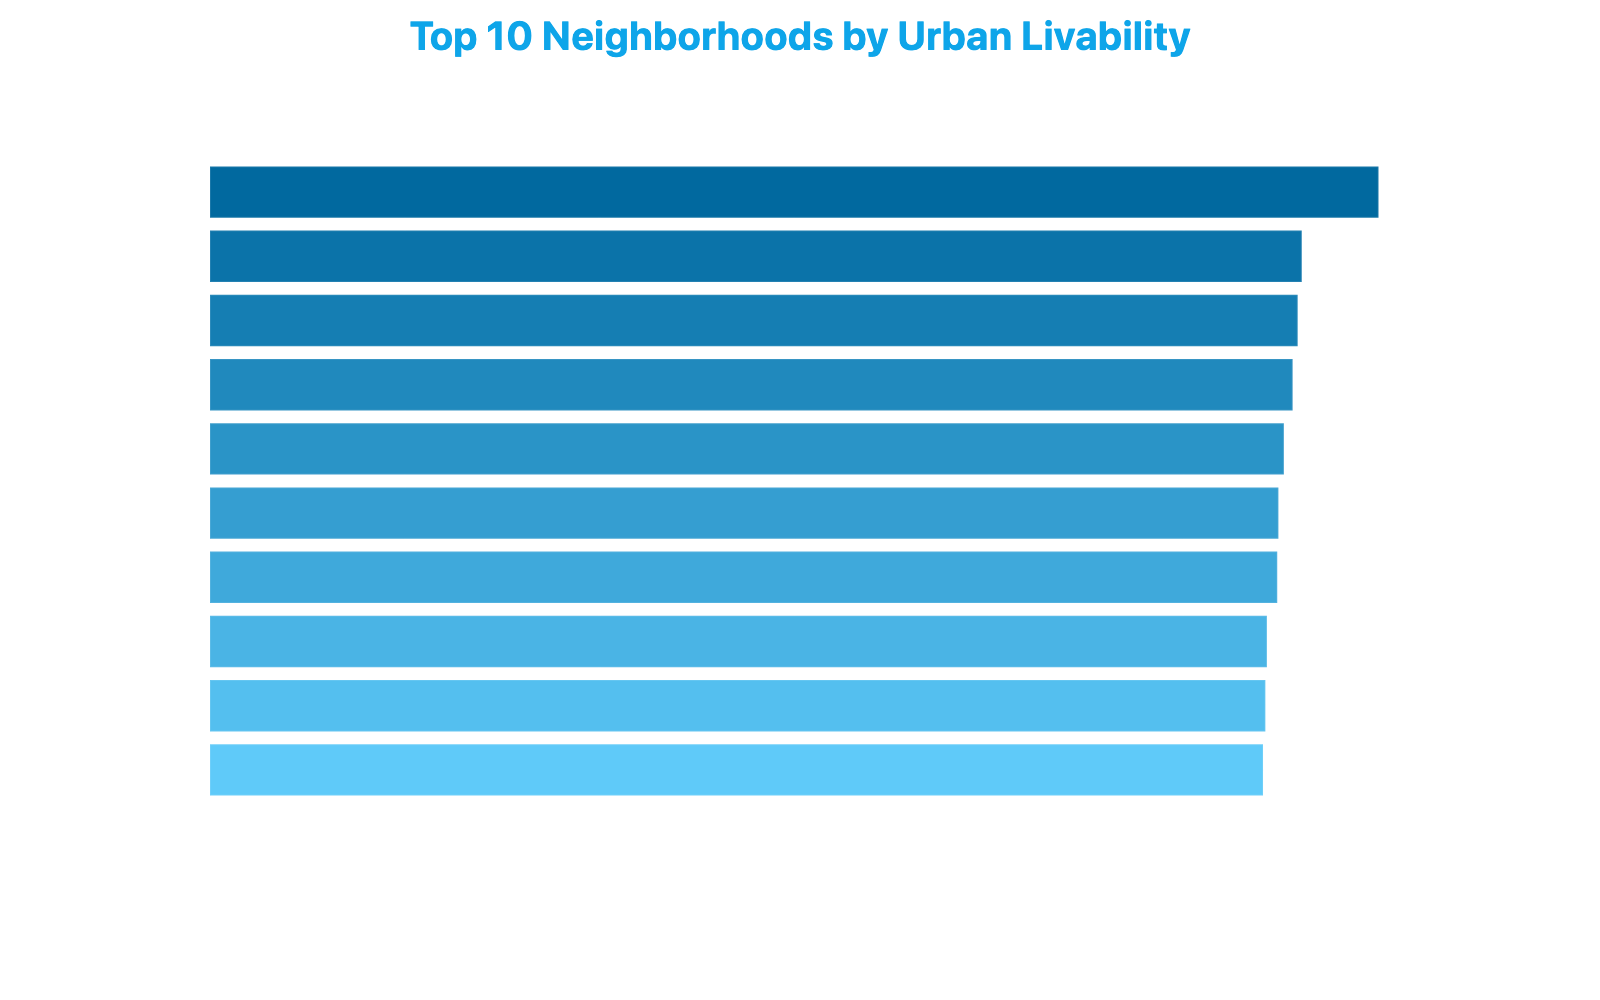
The ranking of Milan's most livable neighborhoods in March 2026 holds surprises. Quartiere Olmi leads with 60.00 points — nearly 12 above the city median of 48.49. A clear margin, in a distribution where all 144 neighborhoods cluster within a relatively narrow band. The city center does not dominate: the top spots belong to residential neighborhoods with large green areas and smooth-flowing streets.
The Green Belt of the Outer Neighborhoods
The Urban Livability index integrates twelve components — from schools to green density, from Urban Decorum to Traffic Flow, from sports facilities to healthcare services — and rewards neighborhoods that perform well across multiple dimensions simultaneously. Excelling on a single aspect is not enough: consistency matters. The final score is a weighted average of 12 indicators, each normalized on a 0-100 scale, drawn from municipal data, geospatial surveys of commercial activities, and a proprietary multi-source model.
Which Are Milan's Most Livable Neighborhoods in 2026?
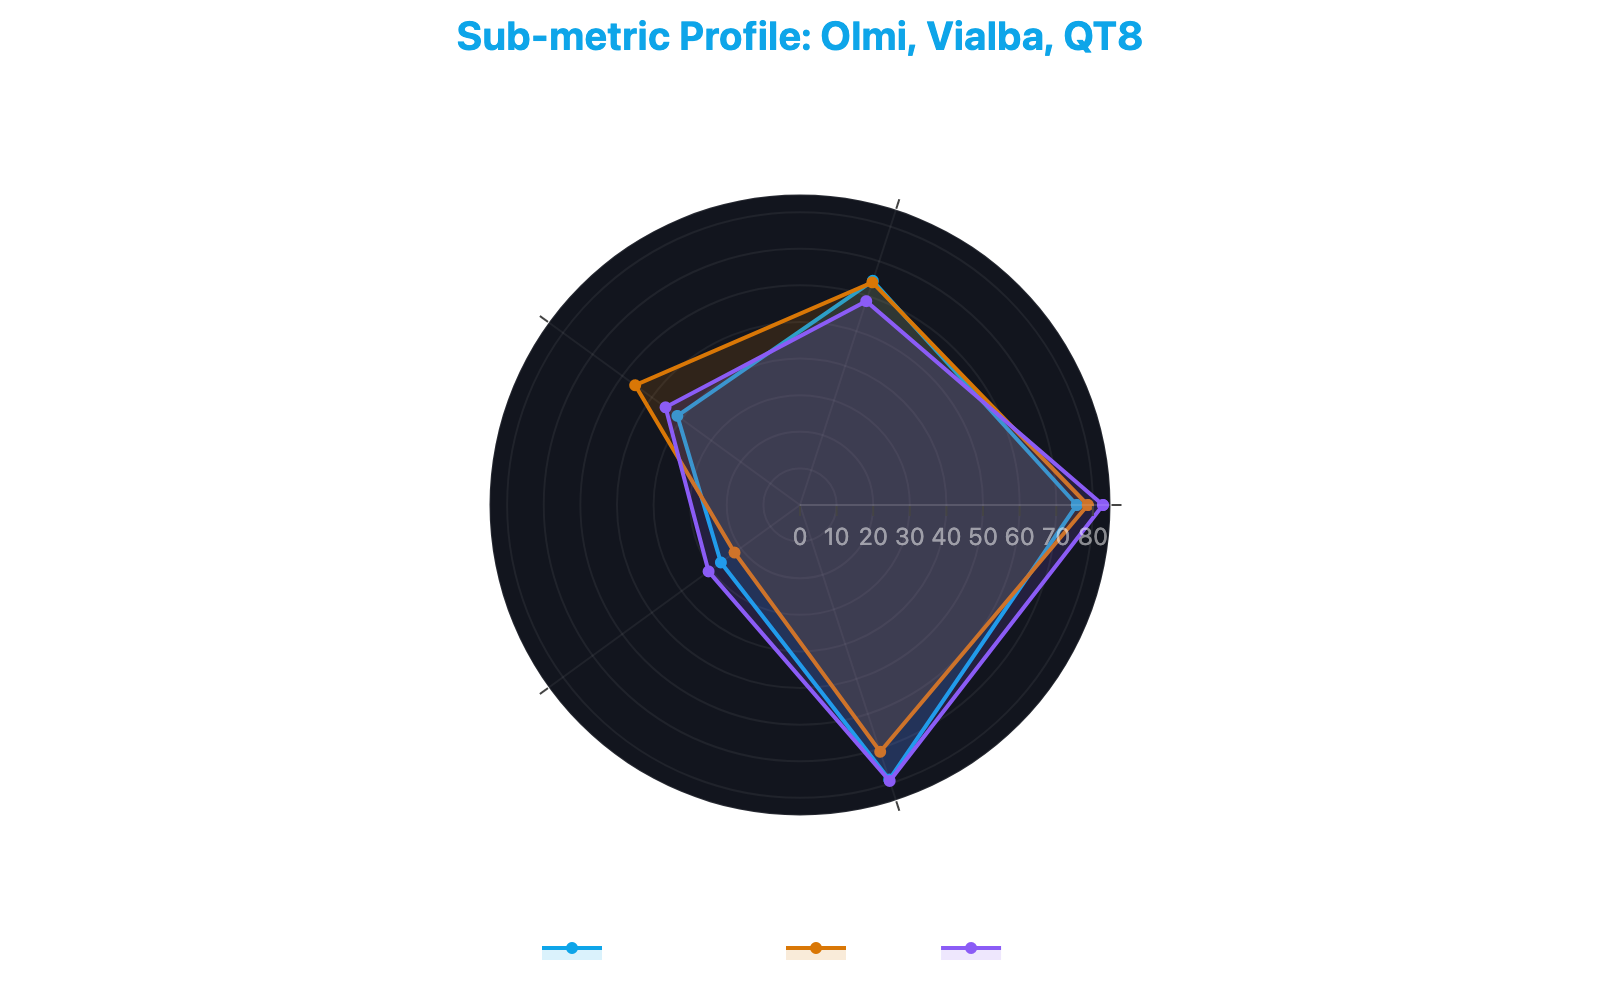
Quartiere Olmi takes first place with a combination of widespread green areas (Green Density at 75.60 versus a city average of 71.03), 14 sports facilities within reach of its streets — nearly double the average of 8 — and a Traffic Flow score of 78.85 points, over 26 points above the city average of 51.97. The trade-off is distance from services: libraries average 1,844 meters from its streets, compared to the city average of 839, and hospitals over 4,300 meters away.
Vialba, second with 56.06 points, offers the most balanced profile in the group. Green Density among the highest (78.61), parks at 537 meters — well below the average of 796 — and the best Road Maintenance in the top 10 at 55.66 points versus the city average of 52.97. It is the neighborhood that loses the least on any single dimension.
QT8, third with 55.85 points, has the highest Green Density in the entire ranking (82.77) and the best Traffic Flow (79.27). Parks reachable in under 500 meters. A neighborhood designed in the 1940s as an urban planning model, whose livability numbers confirm that original vision.
Where the Ranking Surprises
Why Is Prato Centenaro Among the Most Livable Neighborhoods?
Prato Centenaro (55.59 points) stands out for a different reason: it has the highest Urban Decorum in the top 10, at 66.46 points versus a city average of 61.32, and the shortest distance to hospitals — 982 meters versus the 2,723 average. Traffic Flow is less smooth than the top three, but proximity to Healthcare Services compensates. Hospital distances were measured through geospatial surveys of healthcare facilities across the territory.
Tripoli - Soderini (55.14) and Crescenzago (54.86) complete the upper half of the ranking with similar profiles: above-average green areas and reasonably smooth traffic. Crescenzago adds 12 sports facilities nearby.
At the bottom of the top 10 — but still among the very best of Milan's 144 neighborhoods — come Frua, Giambellino, Washington, and Quartiere Feltre, all above 54 points. Frua brings the highest Aesthetics score in the group (40.17 versus 33.33 average) and the nearest library (290 meters). Giambellino, with 15 sports facilities, has the richest sports infrastructure in the ranking. Washington combines high Green Density (80.14) and above-average Aesthetics (33.76).
Do Livability and Housing Prices Align in Milan?
The Common Thread
The cross-cutting finding is clear: livability in Milan does not coincide with real estate prestige. These ten neighborhoods — mostly residential and peripheral — outperform central neighborhoods on green space, sports, and mobility. Where architectural Aesthetics and Road Maintenance do not always shine, the quality of open spaces and Traffic Flow make the difference. A finding that, from a real estate perspective, suggests a gap between perceived value and the fundamentals of daily life — detectable by cross-referencing livability scores with price-per-square-meter values from property listing portals — worth investigating case by case.
Methodology: ranking based on Urban Livability — a weighted average of 12 components including School Access, socialization areas, Urban Decorum, green space, sports facilities, Road Maintenance, pedestrian zones, Traffic Flow, and Healthcare Services — calculated across 144 Milan neighborhoods. Period: March 2026. Neighborhood values represent the average of the streets within them. Data from public and proprietary sources, covering 4,006 streets, 105 metrics, and monthly records since January 2020. Traffic data is based on vehicle flow measurements; distances to services are calculated as the crow flies from the centroid of each neighborhood's streets.
Frequently Asked Questions
Which Milan Neighborhoods Are the Most Livable in 2026?
The ten most livable neighborhoods in Milan in March 2026 are, in order: Quartiere Olmi (60.00 points), Vialba, QT8, Prato Centenaro, Tripoli - Soderini, Crescenzago, Frua, Giambellino, Washington, and Quartiere Feltre. These are predominantly residential and peripheral neighborhoods, united by abundant green space, good Traffic Flow, and the presence of sports facilities.
How Is the Urban Livability Index for Milan's Neighborhoods Calculated?
The index is a weighted average of 12 components — including School Access, Green Density, Urban Decorum, sports facilities, Road Maintenance, pedestrian zones, Traffic Flow, and Healthcare Services — normalized on a 0-100 scale. Each neighborhood's score corresponds to the average of its constituent streets, calculated across a dataset of 4,006 streets and 105 metrics.
Why Don't Central Milan Neighborhoods Top the Livability Ranking?
Central neighborhoods, while having advantages in Aesthetics and proximity to services, lose points on green space, Traffic Flow, and sports infrastructure. The index rewards consistency across all 12 indicators: residential and peripheral neighborhoods rank higher thanks to more open space, smoother traffic, and a greater presence of sports facilities.
Which Milan Neighborhood Has the Most Green Space?
QT8 has the highest Green Density among the 10 most livable neighborhoods, with a score of 82.77 versus a city average of 71.03. Parks are reachable in under 500 meters. Washington follows with 80.14 and Vialba with 78.61.
Is Quartiere Olmi Well Served by Transport and Services?
Quartiere Olmi excels in green space, sports, and Traffic Flow (78.85 points, over 26 above average), but faces greater distances to cultural and healthcare facilities: libraries average 1,844 meters away (versus 839 city average) and hospitals over 4,300 meters (versus 2,723).