Safety in Milan, March 2026: the 10 neighborhoods that climbed the ranking in 12 months
Analysis of 144 neighborhoods: where the safety index improved the most between March 2025 and March 2026
Neighborhood safety in Milan has improved significantly in several areas of the city. Over twelve months, Plebisciti - Susa climbed 27 positions in the safety ranking, moving from 83rd to 56th place. This is not an isolated case: a group of ten neighborhoods recorded gains between 13 and 27 positions — in a distribution where the median delta is zero and the typical deviation stands at 9 positions.
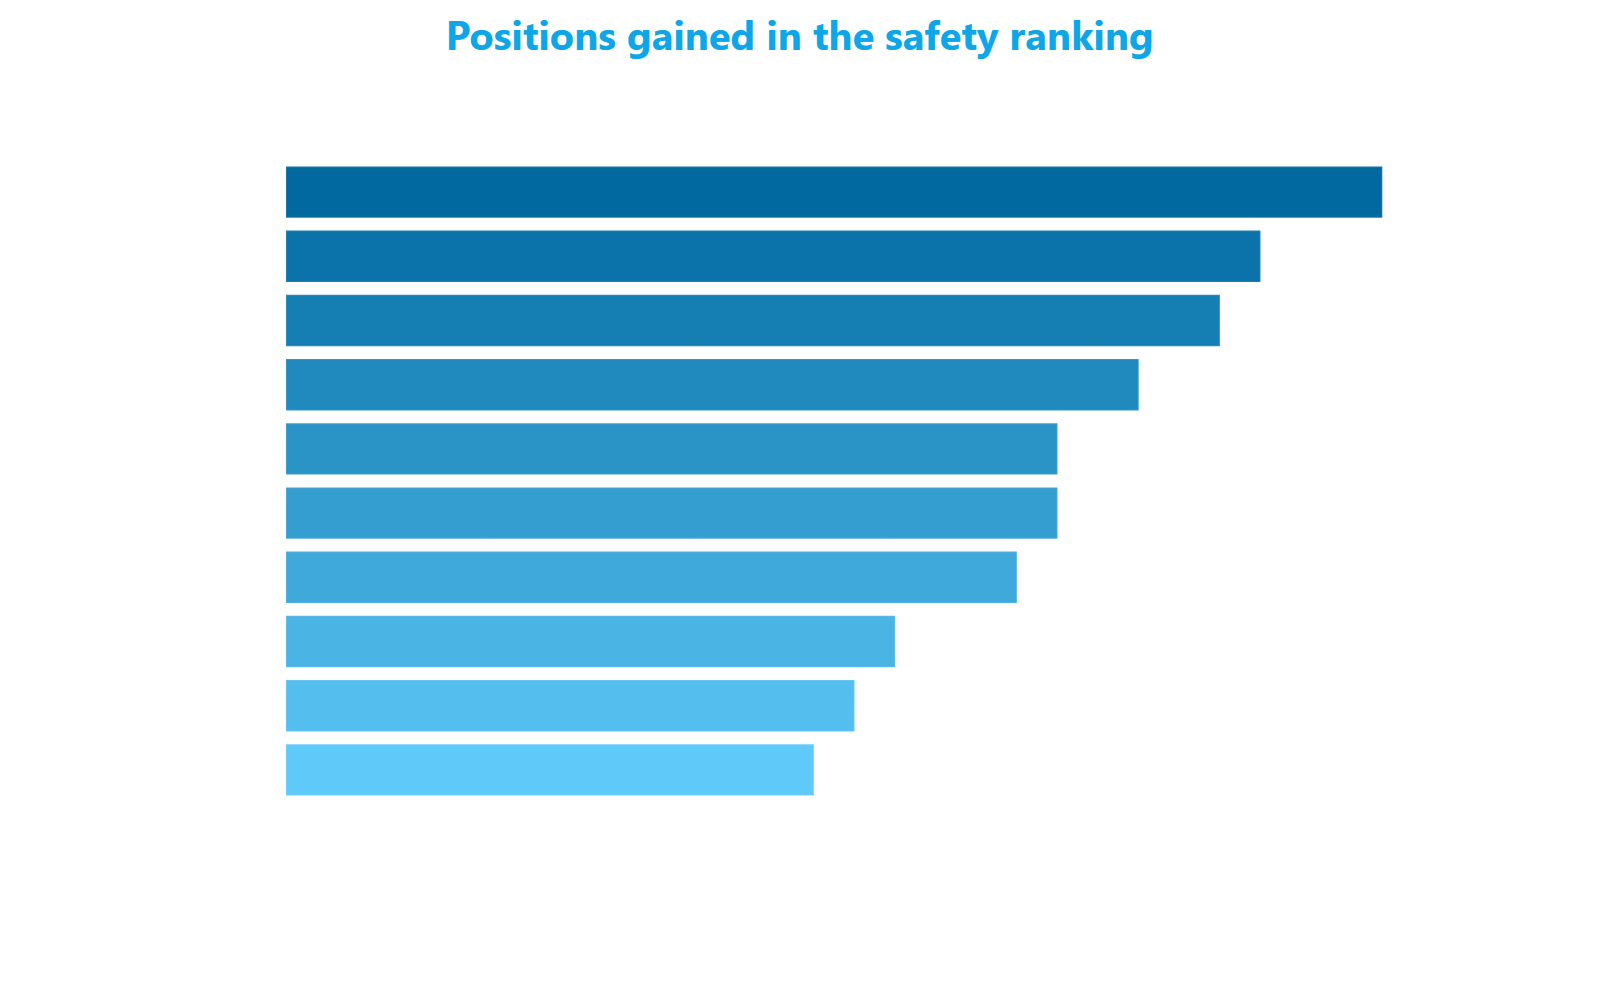
The sharpest climbs
Plebisciti - Susa is the neighborhood with the most marked improvement. The safety index — based on systematic monitoring of crime reporting across 27 offense categories — rose from 59.88 to 72.83 points, a gain of 13 points in one year. A value that now exceeds the city median of 68.41 points, when twelve months ago it fell short.
Cadore follows with 24 positions gained: from 65.63 to 76.76 points, now well above the median. The safety analysis is based on 27 offense categories monitored street by street — all available in detail on the platform, with type, frequency and trend. Roserio, third with a 23-position climb, shows a similar leap: from 63.91 to 75.29 points, with an increase of 11.4 points that places it firmly in the upper half of the ranking.
Which Milan neighborhoods improved the most in safety?
The neighborhoods with the sharpest climb are Plebisciti - Susa (+27 positions), Cadore (+24) and Roserio (+23). In all three cases the safety index rose by more than 11 points in twelve months, bringing them above the city median of 68.41 points. Argonne - Corsica, at 86.29 points, reaches the top 17% of the distribution.
Indipendenza (+21 positions, from 63rd to 42nd) and Argonne - Corsica (+19 positions, from 43rd to 24th) complete the leading group. Argonne - Corsica deserves special mention: at 86.29 points it reaches the top 17% of the city distribution, and its absolute gain — 13.5 points — is the highest among all ten neighborhoods. It was already above the median a year ago; today it sits in a tier that few areas reach.
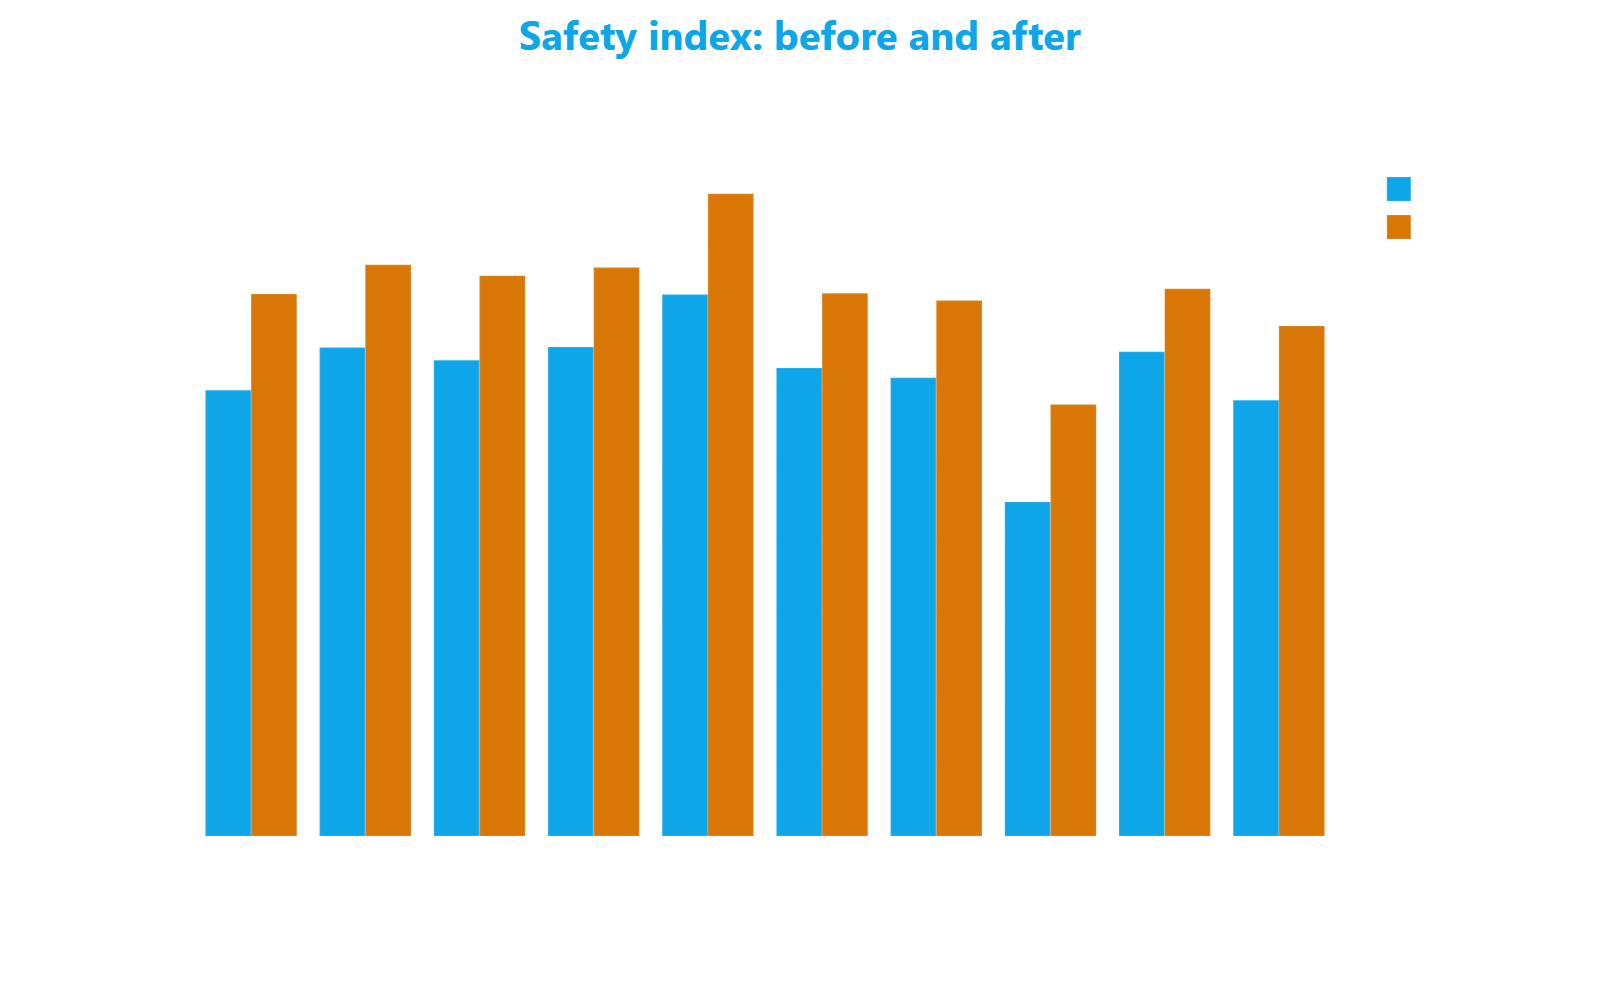
A consistent pattern
Looking at the group as a whole, two common traits emerge.
The first is the scale of improvement: all ten neighborhoods gained between 8.5 and 13.5 points on the safety index. In a city distribution with a mean of 63.90, these are significant shifts — not routine fluctuations. Each variation is calculated by comparing the same indicator, built on crime reporting data, at a twelve-month interval.
The second is the starting tier. Nine out of ten neighborhoods began in the central zone of the ranking, between 43rd and 85th position. These were not deeply troubled areas: they were average neighborhoods that improved markedly. The exception is Portello - Parco Vittoria, which started at 110th place and with a 13.1-point increase climbed to 95th — a substantial improvement, but one that still leaves it below the median, at 57.98 points versus the city's 68.41.
How is the safety index for Milan neighborhoods calculated?
The safety index is built on systematic monitoring of crime reporting, classifying incidents into 27 offense categories and tracking them street by street. Each neighborhood's value is the average of its component streets. The ranking covers 144 neighborhoods, 4,006 streets and has a monthly history dating back to January 2020.
Bologna - Sulmona (+19, from 74th to 55th), Porta Vittoria (+18, from 78th to 60th) and Primaticcio (+14, from 66th to 52nd) share the profile of mid-ranking neighborhoods on the rise. Pezzotti - Meda closes the list with 13 positions gained and an index of 68.51 — practically aligned with the city median.
The concentration of east and southeast neighborhoods among the top ten — Plebisciti - Susa, Cadore, Argonne - Corsica, Porta Vittoria — is a finding that emerges from the ranking without need for interpretation: a quadrant of the city where, in the numbers over the past twelve months, crime reporting recorded fewer incidents compared to the previous period.
Methodology: ranking variation across 144 neighborhoods between March 2025 and March 2026 (12 months). The ranking measures relative position: a rise indicates improvement compared to other neighborhoods. The safety index is based on systematic monitoring of crime reporting. Neighborhood values are the average of their component streets. Data from public and proprietary sources, covering 4,006 streets, 105 metrics, with a monthly history since January 2020.
Frequently Asked Questions
What are the safest neighborhoods in Milan in 2026?
Among the neighborhoods that recorded the most significant improvements, Argonne - Corsica stands out with 86.29 points, ranking in the top 17% of the city distribution. Cadore (76.76 points) and Roserio (75.29 points) comfortably exceed the median of 68.41 points. The full ranking covers 144 neighborhoods and is updated monthly.
How has safety changed in Plebisciti - Susa?
Plebisciti - Susa recorded the sharpest climb among all 144 neighborhoods in Milan: 27 positions gained in twelve months, moving from 83rd to 56th place. The safety index rose from 59.88 to 72.83 points, surpassing the city median of 68.41 points that it failed to reach a year ago.
How many neighborhoods does the Milan safety ranking cover?
The ranking covers all 144 neighborhoods in Milan, with data collected across 4,006 streets and 27 offense categories monitored through systematic analysis of crime reporting. The monthly history begins in January 2020, enabling comparisons across different time horizons.
Has east Milan become safer?
Data from the past twelve months indicate an improvement concentrated in the east and southeast quadrant of the city. Four of the ten neighborhoods with the greatest climb — Plebisciti - Susa, Cadore, Argonne - Corsica and Porta Vittoria — are located in this area, with gains ranging from 18 to 27 positions in the city ranking.
What does a zero median delta mean in the ranking?
A zero median delta indicates that, across the full distribution of 144 neighborhoods, half gained positions and half lost them. The typical deviation is 9 positions. The ten neighborhoods analyzed gained between 13 and 27 positions, a value two to three times greater than the normal variability of the ranking.