Milan, March 2026: the streets that climbed the price ranking in twelve months
Analysis of 4,006 streets: where price per sqm grew fastest compared to the rest of the city
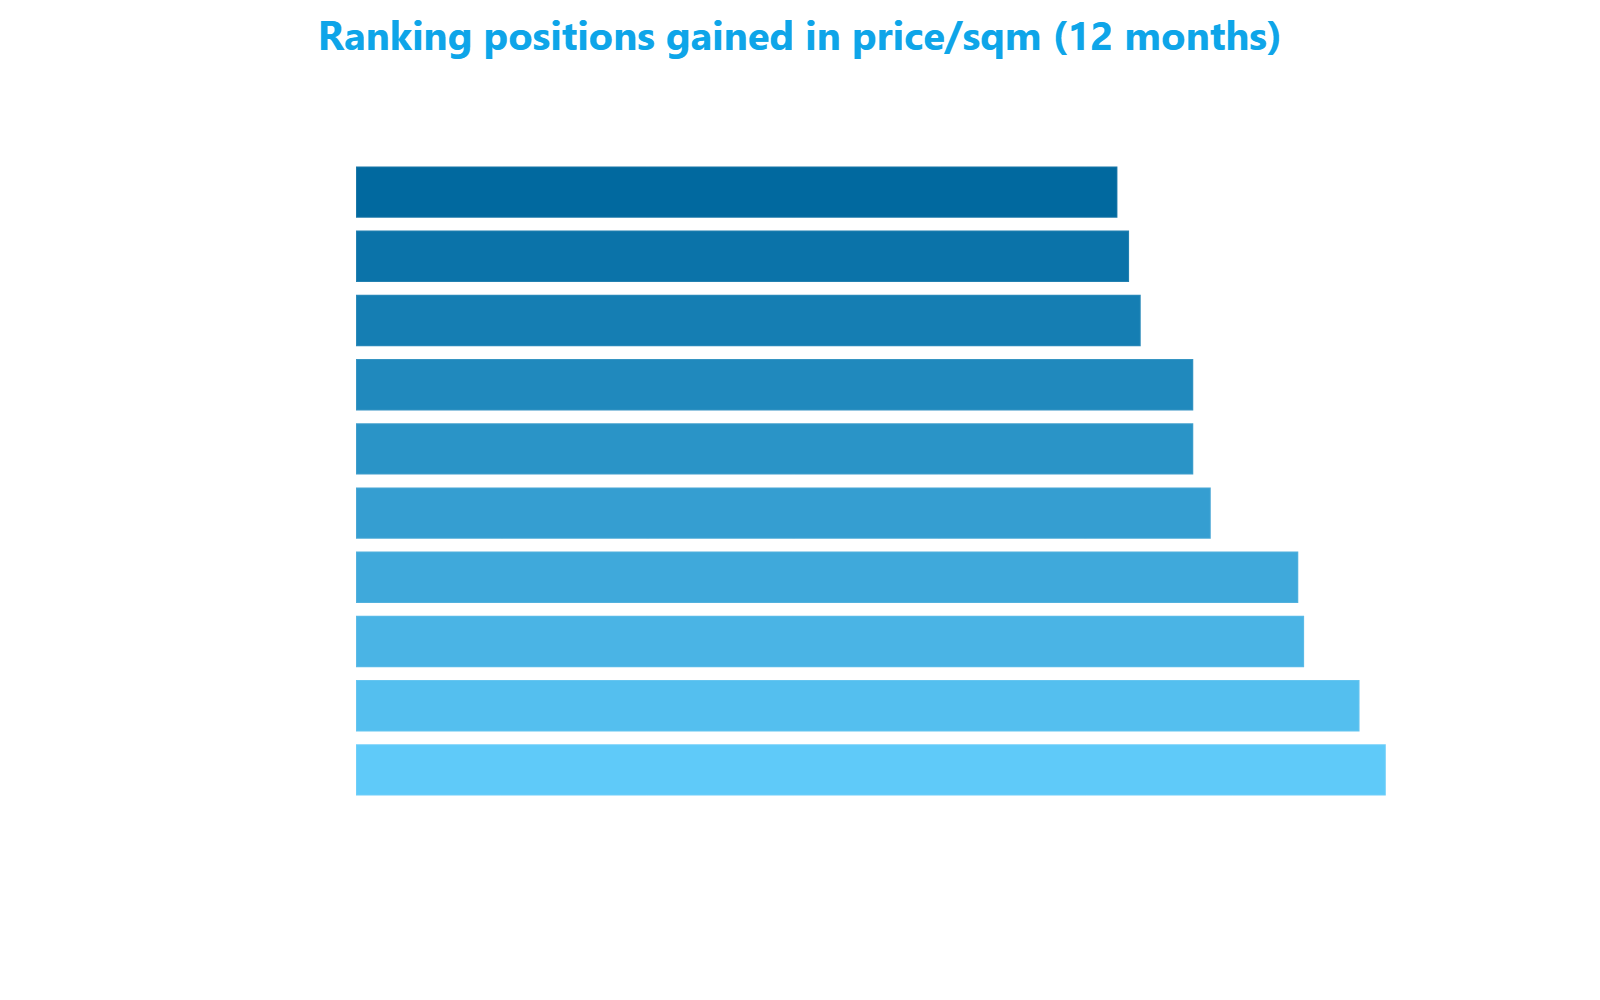
Milan's price per sqm does not move uniformly: some streets accelerate while others stand still. Over twelve months, Via Pasquale Stanislao Mancini in San Siro climbed 353 positions in the price per sqm Street Ranking -- the largest jump recorded among the 4,006 streets tracked by our proprietary multi-source model. This is not an isolated case: of the ten streets that gained the most positions, seven are clustered in the same neighborhood, Forlanini, on the city's south-eastern outskirts. A compact movement that tells a story beyond statistical noise.
The rise of San Siro and Forlanini
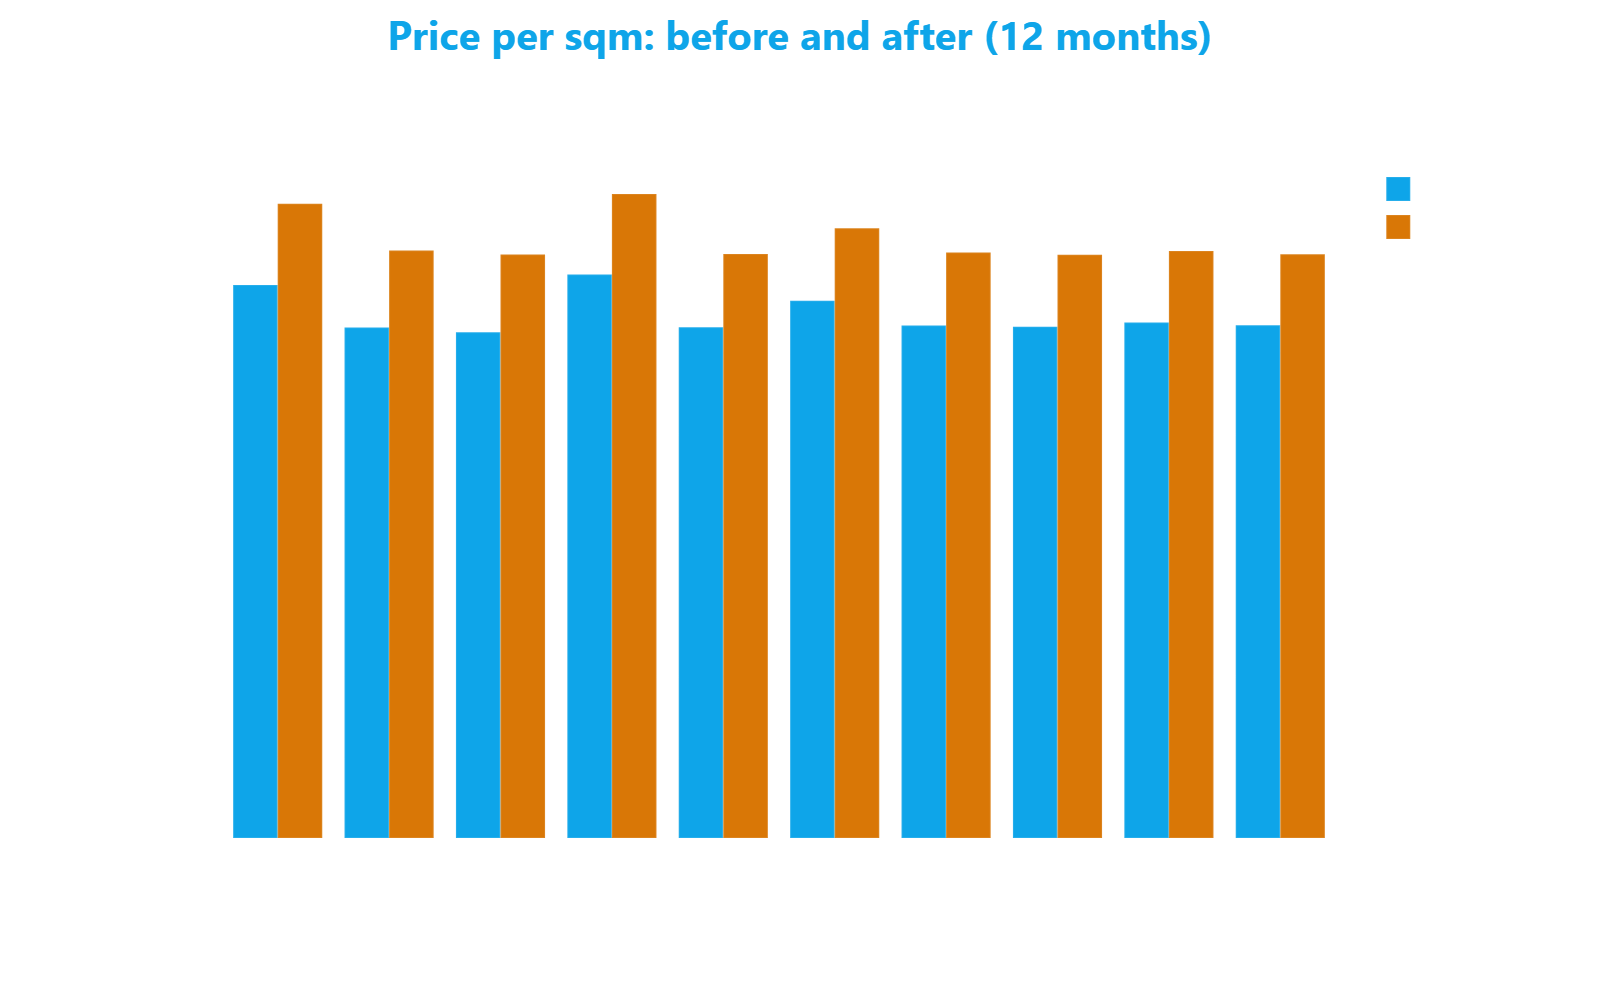
Via Pasquale Stanislao Mancini went from a baseline of 3,426 to 3,929 euro per sqm, an increase of more than 500 euro per sqm. The value remains below the citywide median of 4,478 euro, but the street moved up 353 positions -- a delta worth more than six times the typical variability of ranking shifts.
Right behind, Via Ermanno Barigozzi in Quartiere Forlanini: from 3,163 to 3,640 euro per sqm, 344 positions gained. Third, Viale Enrico Forlanini, same area, same dynamic: from 3,133 to 3,615 euro per sqm, 325 positions up. Via Fausto Coppi, again in San Siro, follows with 323 positions recovered and a 500 euro per sqm increase, reaching a baseline of 3,990 euro -- the highest among the ten, yet still below the median.
How much did price per sqm grow in San Siro's top streets?
The two San Siro streets in the top 10 -- Via Pasquale Stanislao Mancini and Via Fausto Coppi -- recorded increases exceeding 500 euro per sqm over twelve months, with a percentage rise of around 14-15%. Both remain below the citywide median of 4,478 euro, signaling a recovery still in progress.
The Forlanini phenomenon
The most significant finding is not any single street, but the concentration: seven of the ten streets that gained the most ranking positions belong to Quartiere Forlanini. Via Alfonso Cossa, Via Marco Bruto, Via Alessandro Mazzucotelli, Via Maria Montessori, Via Eugenio Bellosio -- all with increases between 440 and 476 euro per sqm and between 261 and 293 positions recovered.
The profile is consistent: they all started from values between 3,163 and 3,194 euro per sqm, well below the citywide median, and now range between 3,614 and 3,640 euro. The gap to the median has narrowed but has not closed: these streets remain in the lower half of the ranking, around position 3,000 out of 4,006. The story is one of a catch-up in progress, not an arrival at the top.
Rounding out the picture, Via Giovanni Labus in Primaticcio gained 287 positions, moving from 3,328 to 3,778 euro per sqm -- the only street among the ten located outside the San Siro-Forlanini pair, but with an entirely consistent dynamic: peripheral area, values below the median, sharp acceleration.
Why is Quartiere Forlanini gaining positions?
The concentration of seven streets out of ten in the same area suggests an area-wide dynamic, not isolated episodes. Quartiere Forlanini started from values significantly below the citywide median and is undergoing a realignment phase, with percentage increases between 14% and 15% -- above the city's average growth. The gap to the median has narrowed but persists.
Growth that narrows the distance
The median ranking delta for the entire city is just 2 positions over twelve months. These ten streets gained between 261 and 353 -- an order of magnitude that signals a structural movement, not statistical noise. In price terms, the increases of 14% to 15% clearly exceed the citywide average growth.
However, these remain streets with baselines between 3,614 and 3,990 euro per sqm, against a citywide median of 4,478 euro. The gap has narrowed but persists: a finding that, in real estate terms, signals a realignment dynamic still underway, worth examining on a case-by-case basis.
Methodology: change in price per sqm ranking across 4,006 streets between March 2025 and March 2026 (12 months). The price per sqm is a purchase baseline calculated through a proprietary multi-source model that cross-references institutional valuations, recent transactions and listing prices from real estate listing portals. The ranking measures relative position: a rise indicates a price increase greater than that of other streets. Data from public and proprietary sources, covering 4,006 streets, 105 metrics with monthly history since January 2020.
Frequently Asked Questions
Which Milan street gained the most positions in the price per sqm ranking?
Via Pasquale Stanislao Mancini in San Siro recorded the largest jump: 353 positions gained over twelve months, moving from 3,426 to 3,929 euro per sqm. An increase exceeding 500 euro per sqm that still remains below the citywide median of 4,478 euro.
What is the median price per sqm in Milan in 2026?
According to the proprietary multi-source model used in this analysis, the citywide median price per sqm stands at 4,478 euro, calculated across a sample of 4,006 streets tracked with monthly history since January 2020.
How much have prices grown in Quartiere Forlanini?
The seven Quartiere Forlanini streets in the top 10 recorded increases between 440 and 476 euro per sqm over twelve months, with percentage rises between 14% and 15%. They started from values between 3,163 and 3,194 euro per sqm and now range between 3,614 and 3,640 euro.
How is the street ranking by price per sqm calculated?
The ranking orders 4,006 Milan streets by price per sqm, calculated by cross-referencing institutional valuations, recent transactions and listing prices. The change in ranking position measures whether a street has grown more or less than others: the citywide median delta is just 2 positions over twelve months.
Have the growing streets reached central area levels?
No. Despite increases of 14% to 15%, the ten streets with the largest ranking gains remain below the citywide median of 4,478 euro per sqm, with values between 3,614 and 3,990 euro. This represents a realignment in progress, not a convergence with the city's most expensive areas.